Introducing Demeter, a clearer daily view of restaurant operations
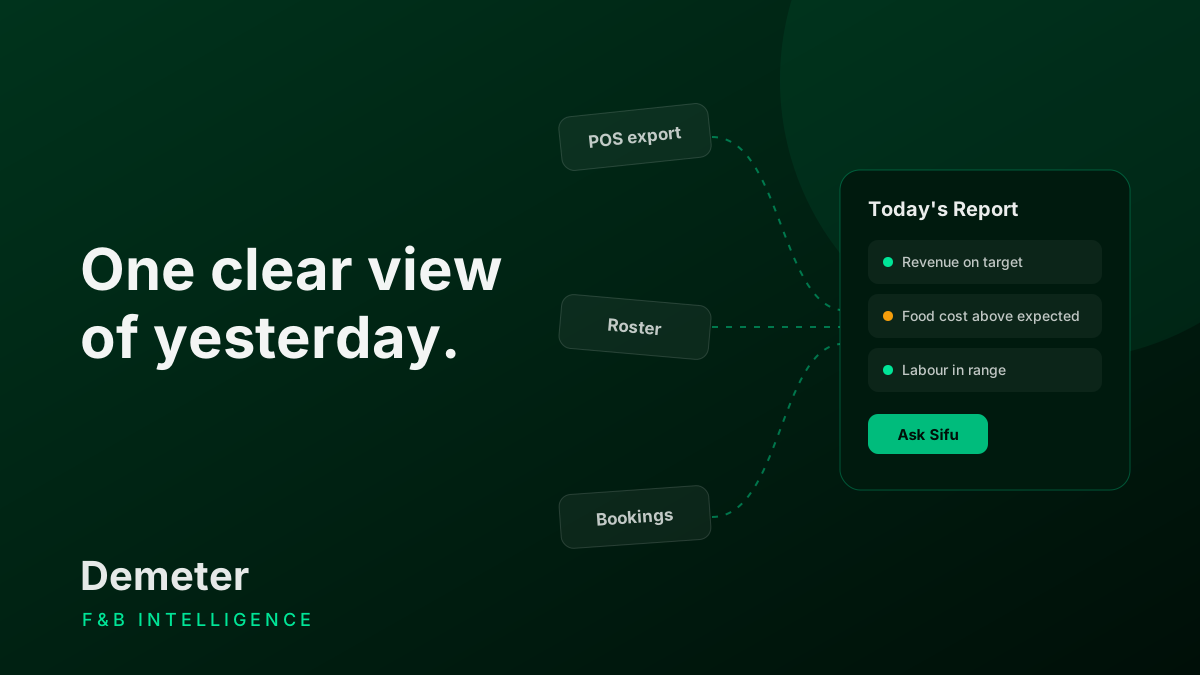
Restaurant teams don't lack data. One day of service leaves behind a POS export, a stock count, a roster, a reservations list and a few WhatsApp threads between outlets.
What's missing is the time to turn all of that into one answer: what happened yesterday, and what needs attention today? That's what Demeter is for.
The problem
Your POS, rosters, reservations and loyalty app each hold one piece of the picture. None of them talk to each other.
So someone exports from each one, lines the numbers up in a spreadsheet and sends it round. By the time it's ready, the moment to act has usually passed. Tomorrow, they do it all again.
What we heard from operators
Earlier this year, we ran a short survey with F&B owners and operators in Singapore. It was a small group, six people, so treat it as a signal rather than a statistic. But the answers lined up closely.
- The numbers get checked every day. Five of the six look at their sales data daily.
- Time is the real cost. Five of the six said saving time would make them switch tools. The same number wanted better insight from the data they already have.
- Margins are watched closely. Most track food cost percentage, gross margin and labour cost against budget.
In other words, teams are already doing the work. They're just doing it by hand, every morning, across too many systems.
Demeter connects to those systems and puts the picture together for you, so it's ready when you open it.
What you get
Today's Report
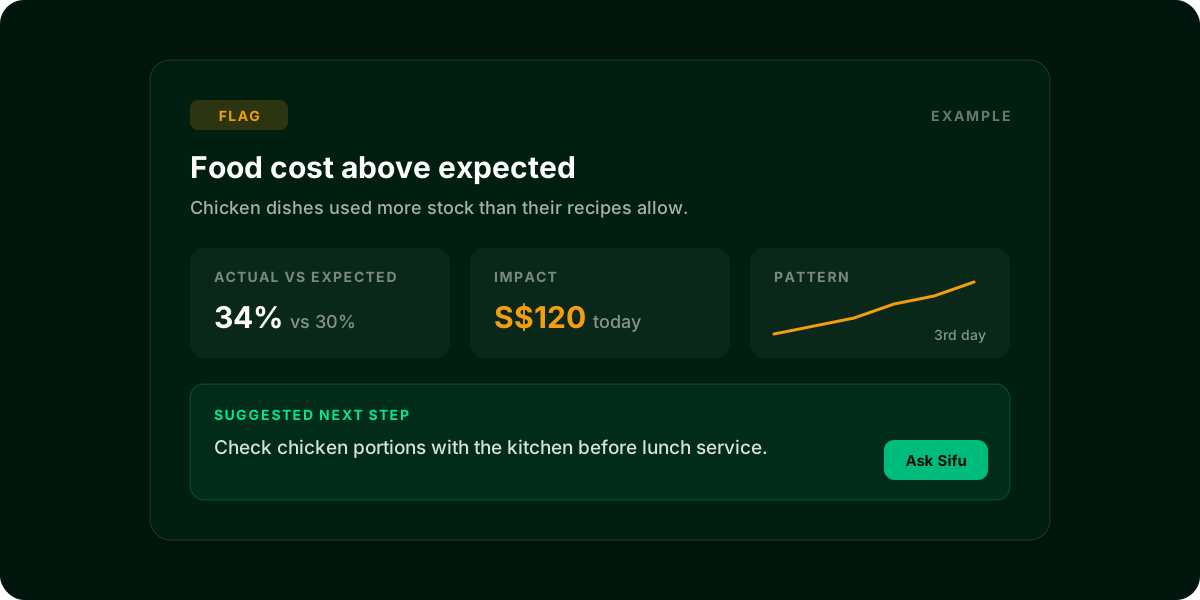
Every morning, Today's Report shows yesterday's numbers for your outlet and flags what's out of line. You don't have to hunt through a wall of figures.
Open a flag and you'll see what happened in plain language, how actual compares to expected, the dollar impact, and whether it's a one-off or getting worse. Each flag ends with a suggested next step. Today's Priorities turns the flags into a short list your team can work through and mark as briefed.
Small moves add up. On an outlet doing $1 million a year, bringing food cost down by 2 percentage points is worth about $20,000 a year. That's simple arithmetic, not a promise, but it's why a flag on food cost is worth catching the day it appears rather than at month end.
Data & Trends
One day rarely tells the whole story. Trends puts sales, reservations, labour, loyalty and food cost side by side over 7, 30 or 90 days, so you compare periods instead of reacting to a single number.
Each section appears once its data source is connected.
AI Sifu
Sometimes it's quicker to just ask. AI Sifu answers questions using the same live data behind your reports, and shows which sources it used, so you can tell a well-backed answer from a thin one.
Tap Ask Sifu on any flag and the chat opens with that flag already loaded.
The right view for each person
Everyone sees only the outlets and screens their role allows. Group Admins manage targets, integrations, outlets and the team from Settings.
Works with what you already use
Demeter doesn't replace your tools. It connects to them.
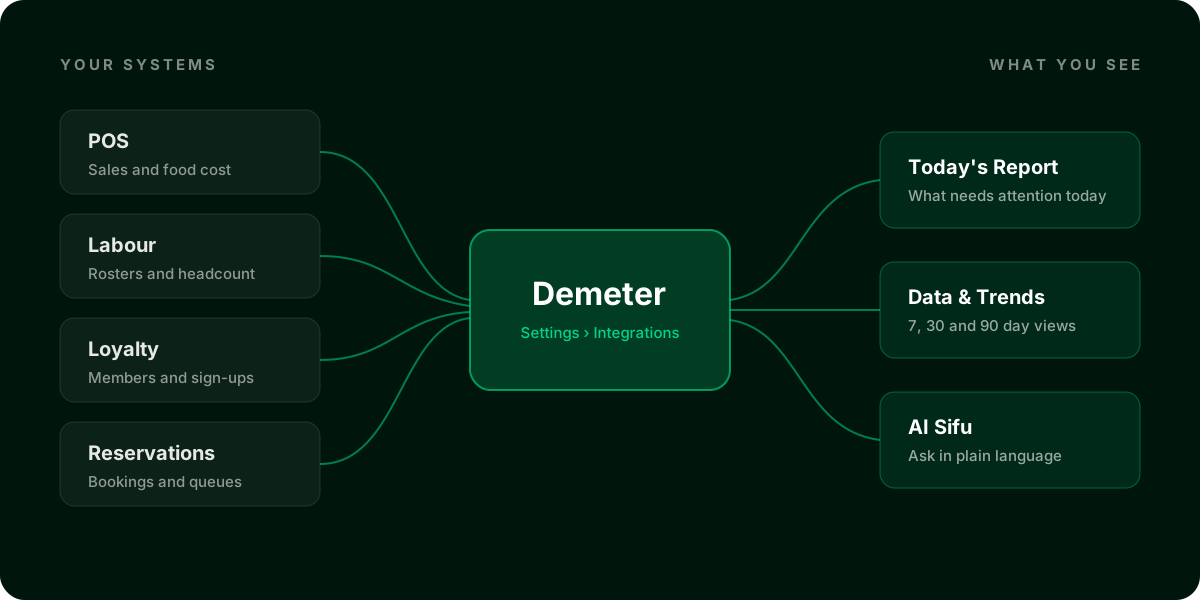
It starts with your POS. Today Demeter supports Eats365, and we're adding more POS systems. From there, each extra connection adds more detail:
- POS: sales, menu items and food cost
- Labour: headcount and revenue per labour hour
- Loyalty: member counts and sign-up channels
- Reservations: bookings, no-shows and walk-ins
Using a different system? Tell us. We're adding more integrations.
All connections live in one place, Settings > Integrations, each with its status and when it last pulled data.
Get started
The Demeter docs cover Today's Report, Trends, AI Sifu and roles.
Want to see it with your own outlets? Book a demo.
Read next: Why your stock numbers drift, and how Demeter Inventory keeps them honest